WW2010
University of Illinois

WW2010
 
welcome
 
online guides
 
archives
 
educational cd-rom
 
current weather
 
about ww2010
 
index

Online Guides
 
introduction
 
meteorology
 
remote sensing
 
reading maps
 
projects, activities

Meteorology
 
introduction
 
air masses, fronts
 
clouds, precipitation
 
el nino
 
forces, winds
 
hurricanes
 
hydrologic cycle
 
light, optics
 
midlatitude cyclones
 
severe storms
 
weather forecasting

Forces, Winds
 
introduction
 
pressure
 
pressure gradient
 
coriolis force
 
geostrophic wind
 
gradient wind
 
friction
 
boundary layer wind
 
sea breezes
 
land breezes

Pressure
 
definition
 
variation with height
 
isobars
 
pressure surfaces
 
variation with temps
 
high pressure center
 
low pressure center

User Interface
 
graphics
text

.
Constant Pressure Surfaces
a surface of equal pressure, also called an isobaric surface

A constant pressure (or isobaric) surface is a surface in the atmosphere where the pressure is equal everywhere along that surface. For example, the 100 millibar (mb) surface is the surface in the atmosphere where the pressure at every point along that surface is 100 mb. Since pressure decreases with height, the altitude of the 100 mb surface is higher than the 500 mb surface, which is likewise higher than 1000 mb. Meteorologists use pressure as a vertical coordinate to simplify thermodynamic computations which are performed on a routine basis.
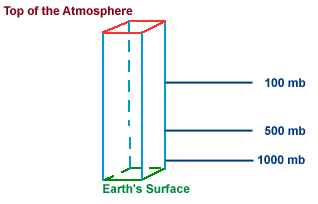
Measurements of the upper atmosphere (temperature, pressure, winds, etc.) are taken by instruments on weather balloons as they rise upward from the earth. When referring to the 500 mb surface, we mean a location in the atmosphere where the pressure has been measured to be 500 mb. The approximate heights and temperatures for several constant pressure surfaces have been listed below:

PressureApproximate Height Approximate Temperature
Sea Level
1000mb
850 mb
700 mb
500 mb
300 mb
200 mb
100 mb
0 m
100 m
1500 m
3000 m
5000 m
9000 m
12000 m
16000 m
0 ft
300 ft
5000 ft
10000 ft
18000 ft
30000 ft
40000 ft
53000 ft
15 C
15 C
05 C
-05 C
-20 C
-45 C
-55 C
-56 C
59 F
59 F
41 F
23 F
-04 F
-49 F
-67 F
-69F
Chart from: WXP Purdue

The atmospheric variables typically plotted on isobaric maps include: height of the pressure surface, temperature, moisture content and wind speed and direction.


isobars
Terms for using data resources. CD-ROM available.
Credits and Acknowledgments for WW2010.
Department of Atmospheric Sciences (DAS) at
the University of Illinois at Urbana-Champaign.

variation with temps