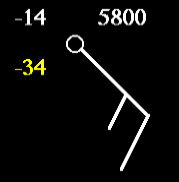
The value highlighted in yellow located
in the lower left corner (in the diagram above) is the
dew point temperature in degrees
Celsius.
In this example, the reported dew point temperature is 58 degrees.
Dew Point Temperature is defined as the temperature at which air
would have to cool (at constant pressure and constant water vapor content)
in order to
reach saturation.
Dew points provide insight into the amount of moisture in the air.
The higher the dew point temperature, the higher the moisture content for
air at a given temperature.
When the dew point temperature and air temperature are equal, the air
is said to be saturated.
Dew point temperature is NEVER GREATER than the air temperature.
Therefore, if the air
cools, moisture must be removed from the air
and this is accomplished through condensation.
This process results in the formation of tiny water droplets that can lead
to the development of fog, frost, clouds, or even precipitation.
Other upper air observation maps may actually report
dew point depression instead of dew point temperature. Dew point
depression is the difference in degrees Celsius between the temperature and
the dew point. In the example above the dew point depression would be 20
degrees.
 What to Look For in Dew Point Observations:
- Relative Humidity
can be inferred from dew point values.
When the air
and dew point temperatures are very close, this indicates
that the air has a high relative humidity. The opposite is true when
there is a large difference between air and dew point temperatures, which
points to air with a low relaitve humidity.

![]() What to Look For in Dew Point Observations:
What to Look For in Dew Point Observations:

