|
|
. |
Interpreting Upper Level Observation Symbols
a quick overview
 |
|
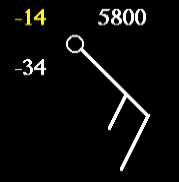
Temperature:
The value highlighted in yellow located
in the upper left corner is the temperature in degrees
Celsius.
In this example, the reported temperature is -14 degrees.
|
 |
|
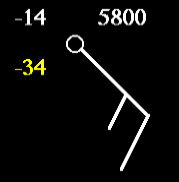
Dew Point Temperature:
The value highlighted in yellow located
in the lower left corner is the
dew point temperature in degrees
Celsius.
In this example, the reported dew point temperature is -34 degrees.
|
 |
|
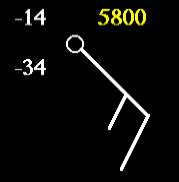
Geopotential Height:
The value highlighted in yellow located
in the upper right corner represents the
geopotential height in meters (m).
|
 |
|
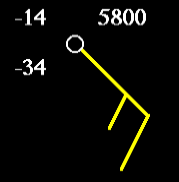
Wind Barb:
The symbol highlighted in yellow
is known as a wind barb.
The wind barb indicates wind direction and wind speed.
|

Observation Maps
|
|

temperature
|
|


