WW2010
University of Illinois

WW2010
 
  welcome
 
> online guides
 
  archives
 
  educational cd-rom
 
  current weather
 
  about ww2010
 
  index

Online Guides
 
  introduction
 
  meteorology
 
  remote sensing
 
> reading maps
 
  projects, activities

Reading Maps
 
  introduction
 
  utc conversions
 
  temp conversions
 
  surface obs
 
  surface maps
 
> upper air obs

Upper Air Obs
 
  overview
 
  temperature
 
  dew point
 
> height
 
  wind barbs
 
  300 winds & heights

User Interface
 
  graphics
> text

NOTE: We've guessed that you're not using a client that supports colored tables and have tried to compensate. Low graphics mode looks much better on clients that do... we recommend switching to Netscape 3.0 or Microsoft Internet Explorer.
.
Geopotential Height
upper air station reports
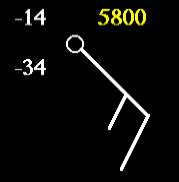
The value highlighted in yellow located in the upper right corner (in the diagram above) represents the geopotential height of a given pressure surface in meters (as reported by weather balloons).

Geopotential Height approximates the actual height of a pressure surface above mean sea-level. Therefore, for the example given above, the height of the pressure surface on which the observation was taken is 5800 meters.

When a collection of geopotential height reports are contoured on a given pressure surface, we are able to identify upper air troughs and ridges, which are very important influences on surface weather conditions.


dew point
Terms for using data resources. CD-ROM available.
Credits and Acknowledgments for WW2010.
Department of Atmospheric Sciences (DAS) at
the University of Illinois at Urbana-Champaign.

wind barbs