WW2010
University of Illinois

WW2010
 
welcome
 
online guides
 
archives
 
educational cd-rom
 
current weather
 
about ww2010
 
index

Online Guides
 
introduction
 
meteorology
 
remote sensing
 
reading maps
 
projects, activities

Reading Maps
 
introduction
 
utc conversions
 
temp conversions
 
surface obs
 
surface maps
 
upper air obs

Surface Obs
 
overview
 
temperature
 
weather
 
dew points
 
cloud cover
 
pressure
 
winds
 
contours

User Interface
 
graphics
text

.
Observed Weather
station reporting symbol

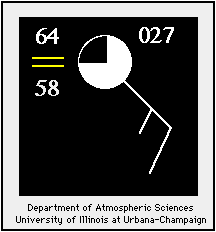
The symbol highlighted in yellow indicates the type of weather occurring at the time the observation is taken. In this case, fog was reported. If there were thunderstorms occurring when the observation was taken, then the symbol for thunderstorms would have appeared instead.
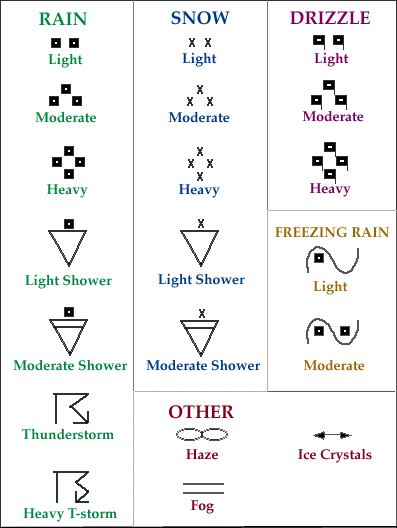
Common Weather Symbols:
The chart below identifies some the most commonly used weather symbols and the type of weather they represent. For example, the first row of weather symbols (from left to right) identify Light Rain, Light Snow and Light Drizzle.


temperature
Terms for using data resources. CD-ROM available.
Credits and Acknowledgments for WW2010.
Department of Atmospheric Sciences (DAS) at
the University of Illinois at Urbana-Champaign.

dew points