WW2010
University of Illinois

WW2010
 
  welcome
 
> online guides
 
  archives
 
  educational cd-rom
 
  current weather
 
  about ww2010
 
  index

Online Guides
 
  introduction
 
  meteorology
 
  remote sensing
 
  reading maps
 
> projects, activities

Projects, Activities
 
  introduction
 
  open-ended projects
 
  classroom activities
 
> teacher guides

Teacher Guides
 
  introduction
 
> pressure
 
  air masses
 
  precipitation
 
  midlatitude cyclones
 
  universal time coord
 
  observation symbols
 
  weather symbols
 
  forecasting temps
 
  forecasting precip

User Interface
 
  graphics
> text

NOTE: We've guessed that you're not using a client that supports colored tables and have tried to compensate. Low graphics mode looks much better on clients that do... we recommend switching to Netscape 3.0 or Microsoft Internet Explorer.
.
Pressure Activity
teacher guide

1) The units are inches of Mercury ("Hg), atmospheres (atm), kilopascals (kPa) and millibars (mb). Millibars is the unit used most by meteorologists.


2) Decreases because the number of molecules above a surface decreases with height. Since there are fewer air molecules at higher levels to exert a force on a surface, the pressure at higher levels is less than at lower levels.


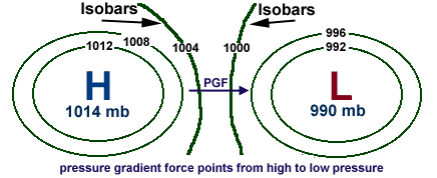
3) A blue "H" represents a high pressure center. A red "L" represents a low pressure center.
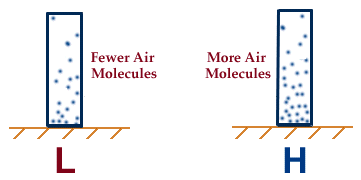

4) A low pressure center should be labeled beneath the left column because there are fewer air molecules in that column to exert a force on the surface below. Therefore, the pressure at the surface is lower (than for the right column).


5) The green contours are isobars and they are lines of constant pressure.

6) Working with current weather data, so no answer key is available.


introduction
Terms for using data resources. CD-ROM available.
Credits and Acknowledgments for WW2010.
Department of Atmospheric Sciences (DAS) at
the University of Illinois at Urbana-Champaign.

air masses