WW2010
University of Illinois

WW2010
 
welcome
 
online guides
 
archives
 
educational cd-rom
 
current weather
 
about ww2010
 
index

Online Guides
 
introduction
 
meteorology
 
remote sensing
 
reading maps
 
projects, activities

Reading Maps
 
introduction
 
utc conversions
 
temp conversions
 
surface obs
 
surface maps
 
upper air obs

Surface Obs
 
overview
 
temperature
 
weather
 
dew points
 
cloud cover
 
pressure
 
winds
 
contours

User Interface
 
graphics
text

.
Observed Sea Level Pressure
station reporting symbol

The value highlighted in yellow located in the upper right corner (in the diagram above) represents the last three digits of the observed pressure reading in millibars (mb).
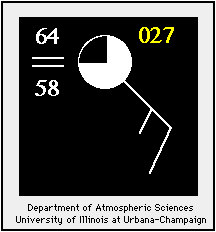

Interpreting Pressure Reports:
If reported value greater than 500:
Initial 9 is missing. Place it on left, then divide by 10.
For example: 827 becomes 982.7 mb.

If reported value less than 500:
Initial 10 is missing. Place it on left, then divide by 10.
For example (as in above diagram): 027 becomes 1002.7 mb.


cloud cover
Terms for using data resources. CD-ROM available.
Credits and Acknowledgments for WW2010.
Department of Atmospheric Sciences (DAS) at
the University of Illinois at Urbana-Champaign.

winds