|
Introduction:
Though you may not realize it, the air has weight. All the air
molecules in the atmosphere exert a force, or pressure, on our bodies.
Atmospheric pressure is the force exerted by the weight
of the air above an object or surface. Variations in pressure generate
winds, which play a significant role in
day to day weather conditions.
The purpose of this activity is to introduce characteristics of pressure,
high and low pressure centers, and a brief analysis of an idealized
pressure field. Key words
throughout this activity link directly to helper resources that provide
useful information for answering the questions.
Characteristics of Pressure:
1) What are the different units of
pressure? Which unit is used most by meteorologists?
2) Circle the correct response in the following sentence: Pressure
(increases / decreases) with height.
Please explain why pressure changes this way with height.
High and Low Pressure Centers:
3) Draw the symbol that represents a high pressure
center on a weather map. Do the same for
a low pressure center.
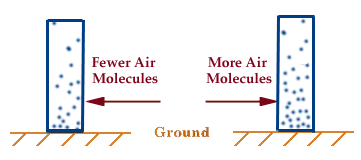
4) Pictured below are two imaginary columns of air
molecules exerting pressure on the
surfaces below them. The left
column contains fewer air molecules than the right column.

Which column is more representative of the atmosphere above a high pressure center? Which one is more likely to be found over a low pressure? Using the correct symbols for labeling high and low pressure centers (see question #3), mark your answers beneath the appropriate columns in the diagram above. You may label the diagram in one of two ways; 1) by printing out a copy of this activity and marking your answers directly onto the printout or 2) by saving the image into your favorite graphics software and modifying the image using that graphics package.
Analysis of a Pressure Field:
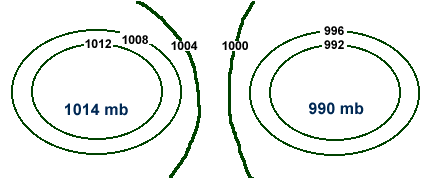
5) The diagram below is an idealized pressure field
resembling those commonly
found on surface weather maps. The numbers along each contour
indicate the pressure value in millibars for that particular contour.
Use the diagram below to answer the following questions.
- What are the green contours? What do they represent?

- Label the diagram above to indicate the positions of the high and low pressure centers. Please use the correct symbols (see question #3). You may label the diagram in one of two ways; 1) by printing out a copy of this activity and marking your answers directly onto the printout or 2) by saving the image into your favorite graphics software and modifying the image using that graphics package.
- Draw an arrow (on the diagram above) to indicate the direction in which the pressure gradient force is pointing.
Examine the Current Pressure Field:
6) Using what you learned in
questions 1-5, open the following
map
and create the latest map of isobars.
On this map, mark the positions of high
and low pressure centers (using the
correct symbols).
You may label your image in one of two ways; 1) by printing out a copy of the image and marking your answers directly onto the printout or 2) by saving the image into your favorite graphics software and modifying the image using that graphics package.

introduction |
|

air masses |