|
Pressure with Height
pressure decreases with increasing altitude
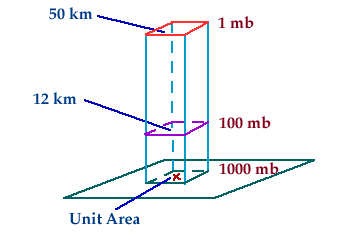
The pressure at any level in the atmosphere
may be interpreted
as the total weight of the air above a unit area at any elevation. At
higher elevations, there are fewer air molecules
above a given surface than a similar surface at lower levels.
For example, there are fewer molecules above
the 50 km surface than are found above the 12 km surface,
which is why the pressure is less at 50 km.

What this implies is that atmospheric pressure decreases
with increasing height.
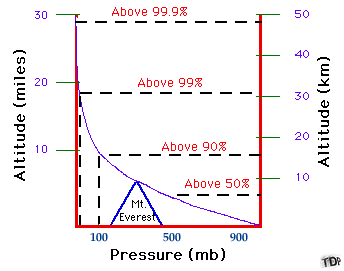
Since most of the atmosphere's molecules are held close to the earth's
surface by the force of gravity, air pressure decreases
rapidly at first, then more slowly at higher levels.

Since more than half of the atmosphere's molecules
are located below an altitude
of 5.5 km, atmospheric pressure decreases roughly
50% (to around 500 mb) within the lowest 5.5 km.
Above 5.5 km, the pressure continues to decrease but at an increasingly
slower rate.
|

