Reference Weather Map |
Current Weather Map |
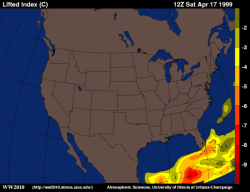
These panels show the most recent observations of lifted index. The lifted index is a sounding variable, meaning that it is a single value at each location, and does not change from one level to another.
The lifted index is a stability index to help measure the buoyancy of the atmosphere. Atmospheric temperature generally decreases with height. When surface air rises, it also cools. However, sometimes it cools more slowly than its surounding environment. When this happens, the rising air is warmer and less dense, and the rising air can continue to rise -- leading to storm development.
Lifted index is measured by subtracting the temperature of a surface air parcel after it has been raised to 500 mb from the atmospheric temperature at 500 mb. Meteorologists use charts to determine the temperature of the rising surface air, since they can not measure the temperature directly. This means that these calculations are made before the storms can form and be used as a forecast tool.
In analyzing lifted index, values greater than zero are not shaded. Values less than -6 are considered favorable for intense convection and possible severe weather in that location.
|
850 mb temps |
|
cape |