WW2010
University of Illinois

WW2010
 
welcome
 
online guides
 
archives
 
educational cd-rom
 
current weather
 
about ww2010
 
index

Archives
 
case studies

Case Studies
 
introduction
 
veterans day snow
 
hurricane andrew
 
4/19 il tornadoes
 
superstorm '93

4/19 IL Tornadoes
 
headlines
 
from the chase
 
the damage
 
how it happened
 
nexrad close-ups
 
data and images

Data and Images
 
introduction
 
composites
 
nexrad images
 
satellite
 
surface
 
upper air images

Upper Air Images
 
introduction
 
12z 4/19/96
 
00z 4/20/96

User Interface
 
graphics
text

.
Upper Air Data
00Z April 20, 1996

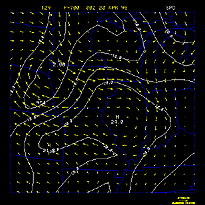
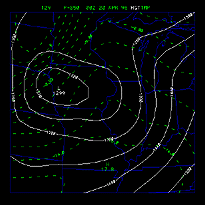
The chart below provides access to an array of upper air analysis plots for the time of 00Z April 19, 1996. These images show the upper level conditions that existed during the time of the severe weather outbreak.

ILX-Lincoln, IL 00z (7 pm) sounding: Skew-T, Hodograph

00z April 20th Upper-air analysis data
Level Height, wind Temperature (C) Dewpoint (C) Wind, speed (m/s) Vorticity (/s*1e5) Ageostrophic wind
920 mb image image image image image image
850 mb image image image image image image
700 mb image image image image image image
500 mb image image image image image image
300 mb image image image image image image


12Z 4/19/96
Terms for using data resources. CD-ROM available.
Credits and Acknowledgments for WW2010.
Department of Atmospheric Sciences (DAS) at
the University of Illinois at Urbana-Champaign.

Superstorm '93