WW2010
University of Illinois

WW2010
 
welcome
 
online guides
 
archives
 
educational cd-rom
 
current weather
 
about ww2010
 
index

Online Guides
 
introduction
 
meteorology
 
remote sensing
 
reading maps
 
projects, activities

Reading Maps
 
introduction
 
utc conversions
 
temp conversions
 
surface obs
 
surface maps
 
upper air obs

Surface Obs
 
overview
 
temperature
 
weather
 
dew points
 
cloud cover
 
pressure
 
winds
 
contours

Contours
 
introduction
 
isobars
 
wind & isobars
 
isotherms
 
isodrosotherms
 
more contouring

User Interface
 
graphics
text

.
Wind Direction and Isobars
surface maps

Winds flow roughly parallel to the isobars, as depicted in the schematic below.

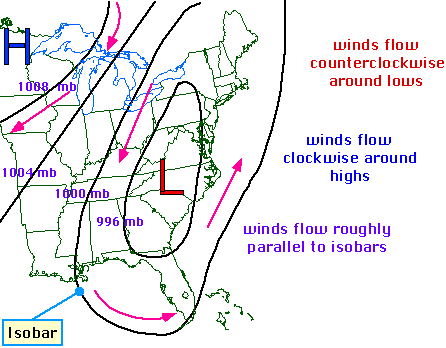
This relationship is observed on real surface maps.

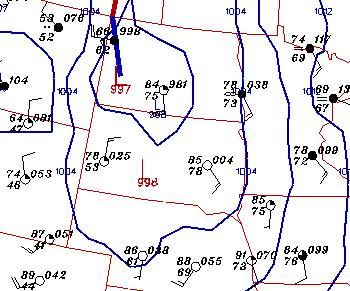
In the example below, surface observations and isobars (yellow contours) have been plotted. Reports of wind direction from Nebraska into Minnesota, show that the observed wind direction is nearly parallel to the isobars.


isobars
Terms for using data resources. CD-ROM available.
Credits and Acknowledgments for WW2010.
Department of Atmospheric Sciences (DAS) at
the University of Illinois at Urbana-Champaign.

isotherms