
|

The following examples showcase where the wind direction is changing.
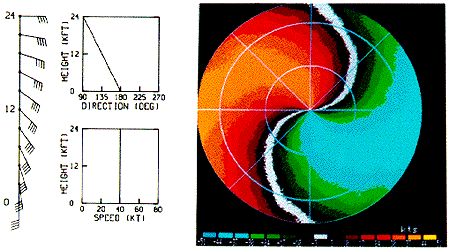
Image by: Brown & Wood
In the first case above, winds back from southerly at the ground to easterly at 24,000 feet. The wind speed does not change. The innermost rings on the radar screen show blue to the south and orange to the north representing a southerly wind. The outermost rings show blue to the east and orange to the west representing easterly winds. Intermediate rings show a progressive change from southerly to easterly as one moves farther from the center of the display. Note the characteristic backward "S" shape to the zero velocity line. This is characteristic of winds backing with height.
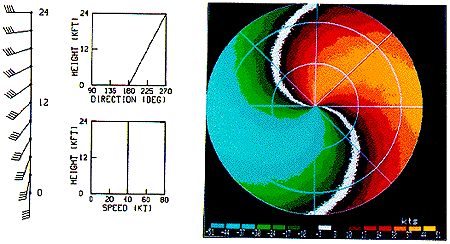
Image by: Brown & Wood
In the second example, the interpretation is exactly the opposite. The winds are veering with height and the zero line takes the shape of a normal "S"
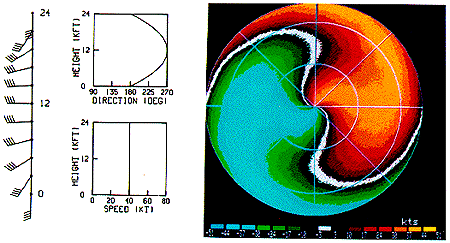
Image by: Brown & Wood
In our third example, winds veer with height to 12,000 feet and then back to 24,000 feet. The inner rings show the characteristic normal "S" pattern while the outer rings show the reverse.

Image by: Brown & Wood
In our fourth example, a cold front is moving toward the radar from the northwest. East of the cold front, winds are from the southwest. The Doppler velocity pattern depicts the southwest winds. Behind the cold front where northwesterly winds are present, all of the winds are inbound toward the radar and appear with blue and green colors. The sharp boundary between the reds and greens on the north part of the display defines the cold front.
|
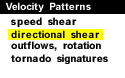
speed shear |
|
outflows, rotation |