|
|
From The Developers...
We spent considerable time fine tuning the scripts and color palettes to produce a large collection of high quality image products, not to mention some new and unique products too. |
Improved Color Palettes:
We assembled
a collection of our finest weather geeks and came up with an extensive list
of desired weather products. Once the scripts were written, we examined
each product, image
by image, fine tuning each color table so that the important features
of each image would easily stand out.
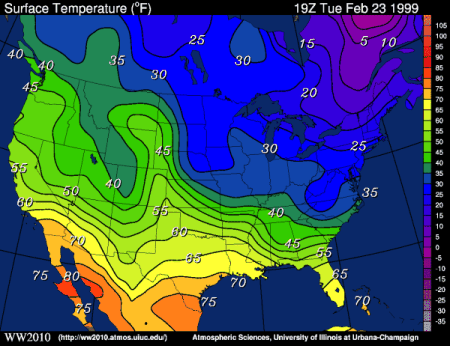
An example of this fine tuning is given below.

This is a surface temperature map.
From first glance, it's very apparent where the warm and cool air is located
and where the temperature contrast is greatest.
This type of thinking was used in the fine tuning of color palettes for
wind speed, absolute vorticity, dew point temperature and other related fields.
New Products:
As various graduate students were writing the scripts for
generating images, they began to produce other
products not seen (or very rarely seen) on the Internet (like
isentropic maps).

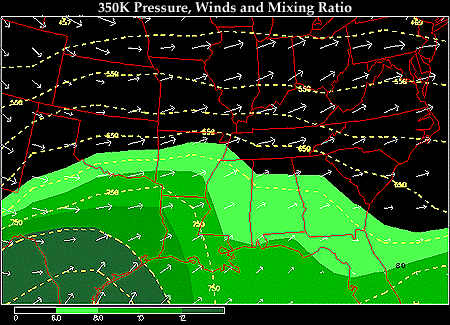
This is an example of a 350K isentropic surface with plotted pressure contours,
wind vectors and mixing ratio.
Locations where wind vectors are flowing across the isobars
towards lower pressures are also regions of upward motion, which
is useful for determining where precipitation will likely develop.

overview |
|

product helpers |


