WW2010
University of Illinois

Helper Menu
 
  exit helper
 
  previous page
 
> helper page
 
  more detail

NOTE: We've guessed that you're not using a client that supports colored tables and have tried to compensate. Low graphics mode looks much better on clients that do... we recommend switching to Netscape 3.0 or Microsoft Internet Explorer.
.
Isobars
lines of constant pressure

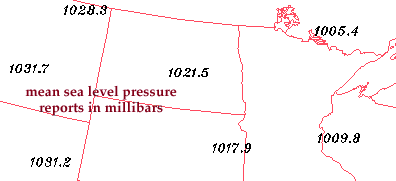
A line drawn on a weather map connecting points of equal pressure is called an "isobar". Isobars are generated from mean sea-level pressure reports and are given in millibars.
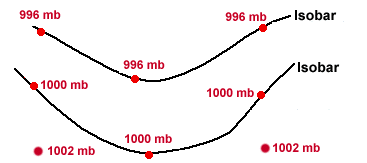
The diagram below depicts a pair of sample isobars. At every point along the top isobar, the pressure is 996 mb while at every point along the bottom isobar, the pressure is 1000 mb. Points above the 1000 mb isobar have a lower pressure and points below that isobar have a higher pressure.

Terms for using data resources. CD-ROM available.
Credits and Acknowledgments for WW2010.
Department of Atmospheric Sciences (DAS) at
the University of Illinois at Urbana-Champaign.