|
|
. |
Advection
transport of something from one region to another
The term advection refers to the transport of something
from one region to another. Meteorologists are most interested in the
advection of variables like temperature, moisture and vorticity.
Assessing advection on weather maps is dependent upon two factors;
1) the strength of the wind and 2) the angle of the wind relative to the
lines of equal value (isolines) of the variable being advected. The strongest
advection occurs when the winds are oriented perpendicular (at 90 degrees)
relative to the isolines.
No advection occurs if the winds are parallel to the isolines.
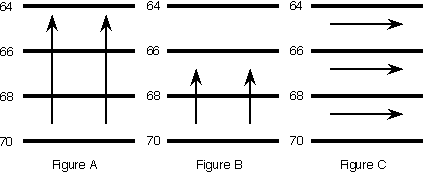
The figures below
depict three different examples of
temperature advection. The arrows
are wind vectors and the horizontal lines
are isotherms (lines of constant temperature) in degrees Fahrenheit.

The wind vectors
are longer in Figure A than they are in Figure B, which
implies that the winds are stronger in Figure A. Since in both cases the
winds are aligned perpendicular to the isotherms, stronger advection is
occurring in Figure A than Figure B, because of the stronger winds in A.
In Figure C, no advection is occurring
because the wind vectors are parallel to the isotherms, indicating no
horizontal transport of temperature.
|
