|

Reference Weather Map |
Current Weather Map |
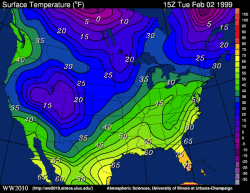
This surface meteorological chart shows the temperature pattern (in degrees Fahrenheit) over the continental United Sates and is updated every hour.
Surface temperature reported at each station are contoured every five degrees Fahrenheit. Areas of warm and hot temperatures are depicted by orange and red colors and cold temperatures (below freezing) are shaded blue and purple. Areas of sharp temperature gradients (several contours close to each other) tend to be associated with the position of surface fronts. Fronts separate airmasses of different temperature and moisture (and therefore density) characteristics.
In the example above on the left, there is a large change in temperature from western Oklahoma to central Texas. This suggests that a front is somewhere in the area. You can check the current map (above right) to see is there are areas that also appear to be affected by fronts.

Contours |
|

press & temp |


