
|

 |
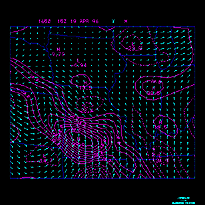 |
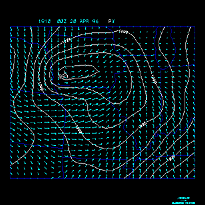
The chart below provides access to an array of surface analysis plots for the time period of 12Z April 19 to 03Z April 20, 1996.
| Field | 12 | 15 | 18 | 21 | 00 | 03 | current |
|---|---|---|---|---|---|---|---|
| Pressure (mb), wind | img | img | img | img | img | img | img |
| Pressure (mb), temperature (F) | img | img | img | img | img | img | img |
| Pressure (mb), dewpoint (F) | img | img | img | img | img | img | img |
| Moisture convergence | img | img | img | img | img | img | img |
| Temperature advection (F/day) | img | img | img | img | img | img | img |
| Dewpoint advection (F/day) | img | img | img | img | img | img | n/a |
| 3-hour temperature change (F) | img | img | img | img | img | img | n/a |
| 3-hour dewpoint change (F) | img | img | img | img | img | img | n/a |
| 3-hour pressure, vector wind change | img | img | img | img | img | img | img |
| Relative vorticity (/s*1e5) | img | img | img | img | img | img | n/a |
| Reported weather | img | img | img | img | img | img | img |
/arch/cases/960419/data/sfc/12.wind.gif)
/arch/cases/960419/data/sfc/15.wind.gif)
/arch/cases/960419/data/sfc/18.wind.gif)
/arch/cases/960419/data/sfc/21.wind.gif)
/arch/cases/960419/data/sfc/00.wind.gif)
/arch/cases/960419/data/sfc/03.wind.gif)
/arch/cases/960419/data/sfc/12.temp.gif)
/arch/cases/960419/data/sfc/15.temp.gif)
/arch/cases/960419/data/sfc/18.temp.gif)
/arch/cases/960419/data/sfc/21.temp.gif)
/arch/cases/960419/data/sfc/00.temp.gif)
/arch/cases/960419/data/sfc/03.temp.gif)
/arch/cases/960419/data/sfc/12.dewpt.gif)
/arch/cases/960419/data/sfc/15.dewpt.gif)
/arch/cases/960419/data/sfc/18.dewpt.gif)
/arch/cases/960419/data/sfc/21.dewpt.gif)
/arch/cases/960419/data/sfc/00.dewpt.gif)
/arch/cases/960419/data/sfc/03.dewpt.gif)
/arch/cases/960419/data/sfc/12.mconv.gif)
/arch/cases/960419/data/sfc/15.mconv.gif)
/arch/cases/960419/data/sfc/18.mconv.gif)
/arch/cases/960419/data/sfc/21.mconv.gif)
/arch/cases/960419/data/sfc/00.mconv.gif)
/arch/cases/960419/data/sfc/03.mconv.gif)
/arch/cases/960419/data/sfc/12.tadv.gif)
/arch/cases/960419/data/sfc/15.tadv.gif)
/arch/cases/960419/data/sfc/18.tadv.gif)
/arch/cases/960419/data/sfc/21.tadv.gif)
/arch/cases/960419/data/sfc/00.tadv.gif)
/arch/cases/960419/data/sfc/03.tadv.gif)
/arch/cases/960419/data/sfc/12.dadv.gif)
/arch/cases/960419/data/sfc/15.dadv.gif)
/arch/cases/960419/data/sfc/18.dadv.gif)
/arch/cases/960419/data/sfc/21.dadv.gif)
/arch/cases/960419/data/sfc/00.dadv.gif)
/arch/cases/960419/data/sfc/03.dadv.gif)
/arch/cases/960419/data/sfc/12.dt.gif)
/arch/cases/960419/data/sfc/15.dt.gif)
/arch/cases/960419/data/sfc/18.dt.gif)
/arch/cases/960419/data/sfc/21.dt.gif)
/arch/cases/960419/data/sfc/00.dt.gif)
/arch/cases/960419/data/sfc/03.dt.gif)
/arch/cases/960419/data/sfc/12.dd.gif)
/arch/cases/960419/data/sfc/15.dd.gif)
/arch/cases/960419/data/sfc/18.dd.gif)
/arch/cases/960419/data/sfc/21.dd.gif)
/arch/cases/960419/data/sfc/00.dd.gif)
/arch/cases/960419/data/sfc/03.dd.gif)
/arch/cases/960419/data/sfc/12.dpdw.gif)
/arch/cases/960419/data/sfc/15.dpdw.gif)
/arch/cases/960419/data/sfc/18.dpdw.gif)
/arch/cases/960419/data/sfc/21.dpdw.gif)
/arch/cases/960419/data/sfc/00.dpdw.gif)
/arch/cases/960419/data/sfc/03.dpdw.gif)
/arch/cases/960419/data/sfc/12.vort.gif)
/arch/cases/960419/data/sfc/15.vort.gif)
/arch/cases/960419/data/sfc/18.vort.gif)
/arch/cases/960419/data/sfc/21.vort.gif)
/arch/cases/960419/data/sfc/00.vort.gif)
/arch/cases/960419/data/sfc/03.vort.gif)
/arch/cases/960419/data/sfc/12.wx.gif)
/arch/cases/960419/data/sfc/15.wx.gif)
/arch/cases/960419/data/sfc/18.wx.gif)
/arch/cases/960419/data/sfc/21.wx.gif)
/arch/cases/960419/data/sfc/00.wx.gif)
/arch/cases/960419/data/sfc/03.wx.gif)
|
satellite |
|
Upper Air Images |