|
|
. |
Wind Vectors
indicate wind direction and speed
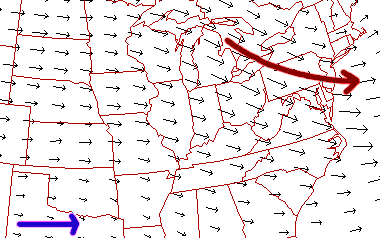
The black arrows plotted on this image are wind vectors. These vectors
indicate direction and intensity of the wind.
The vectors point in the direction to which the wind is blowing and
in this image, winds are primarily blowing from west to east.
Intensity of the wind is conveyed through the size of the vector.
The longer the arrows, the stronger the winds.

For example, wind vectors in the vicinity of the blue arrow are longer
than those near the green arrow. This means that by the blue arrow, the
winds are stronger, than by the green arrow.
|
