
|


Reference Weather Map |
Current Weather Map |
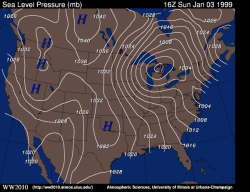
This panel depicts sea-level pressure across the United States. This chart is useful for finding regions of high and low pressure systems.
The solid white contours represent pressure contours (isobars) in millibars. The isobars have an interval of 4 millibars. The wind speed is directly related to the distance between the isobars. The closer they are together, the stronger the pressure gradient, and the stronger the wind. Low and high pressure systems can also be located from the map above. Low pressure systems are located in the regions of the lowest pressure, while high pressure systems are located in the regions of highest pressure.
For more information on how pressure affects the weather go to our forces and winds module.
|
Dew Point Maps |
|
pressure & wind |