
|


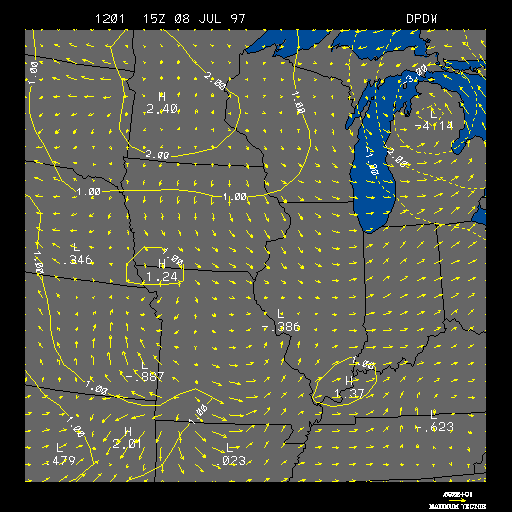
Example Surface 3 Hour Pressure and Wind Change
This is the Surface 3 Hour Pressure and Wind Change image, and on this image
are areas of 3 hour positive and negative pressure change, plus 3 hour wind
changes. This image is useful to predict the direction that the low or high
pressure systems will likely travel.
Positive pressure change areas are contoured in solid yellow lines and indicate that the pressure is rising. Negative pressure change areas are contoured in dashed yellow lines and indicate that the pressure is falling. Both pressure change areas are contoured in intervals of one millibar. Therefore, a positive pressure change contour of 2 would indicate that the pressure has risen by 2 millibars in the past 3 hours within that contour.
The 3 hour wind change is represented by wind vectors in units of meters per second, as indicated by the length of each wind vector. The wind vectors also show the change in wind direction during the past 3 hours, as indicated by the direction the arrow is pointing. The length and magnitude of the strongest wind vector is shown in the lower right-hand corner.
This image is useful since low pressure systems (i.e., cyclones) tend to move to regions of the greatest negative pressure changes (where the pressure is falling most rapidly) and high pressure systems tend to move to regions of the greatest positive pressure changes (where the pressure is rising most rapidly). Therefore, from this image one can predict the direction that the low or high pressure systems will likely travel. Also, one can estimate whether or not the system is strengthening or weakening by examining the pressure change. For example, if there is a large drop in pressure ahead of a cyclone, that would indicate that the cyclone is increasing in strength (or as meteorologists say, "the cyclone is deepening").
The 3 hour wind changes can help to show the location of fronts, since one characteristic of both cold and warm fronts is a change in wind direction across the front.
The example image above shows an area of negative pressure change located in Michigan and an area of positive pressure change in Minnesota. These pressure change areas are indications that a low pressure system is moving from Minnesota towards Michigan. An increase in the westerly winds can be found between the pressure change areas, which is an indication that a cold front is passing through that area.
|
3hr temp & wind |
|
frontogenesis |