|
Introduction:
An air mass is a large body of air with similar temperature and
moisture properties throughout. The best source regions for air masses
are large flat areas where air can be stagnant long enough to take on the
characteristics of the surface below.
As an air mass moves away from its source region, it is modified
as it encounters conditions different than those found in the source region.
Air masses typically clash in the middle latitudes, producing some very
interesting weather.
The purpose of this activity is to introduce air masses that commonly influence the weather in the United States, characteristics of these air masses, and how to identify air masses on weather maps. Key words throughout this activity link directly to helper resources that provide useful information for answering the questions.
Characteristics of Air Masses:
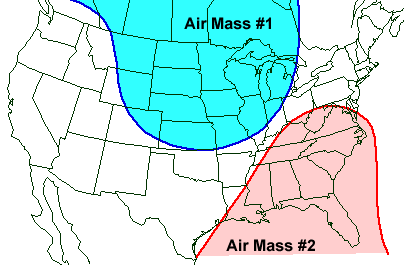
1) The diagram below depicts two types of air masses that commonly
influence weather in the United States. For each air mass, identify
the following characteristics.

| Air Mass #1 | Air Mass #2 | |
|---|---|---|
|
Type of Air Mass:
|
Find the Air Masses:
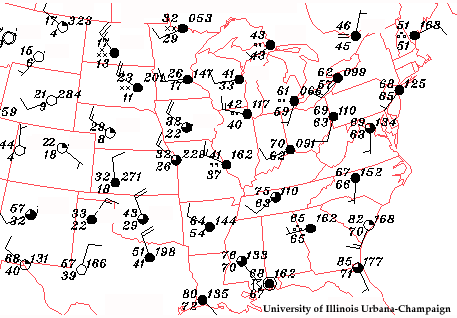
2) One way of identifying a tropical air mass on the weather map below is to
look for a region of higher temperatures. To find a
polar air mass, look for a region of colder temperatures.
The image below is a map of surface observations and for
this part of the activity,
use the temperature field to draw two lines; a red line
to outline the edge of a tropical air mass and a blue line to
identify a polar air mass. Here is an
example. You may label the diagram
in one of two ways; 1) by printing out a copy of this activity and marking your
answers directly onto the printout or 2) by saving the image into your favorite
graphics software and modifying the image using that graphics package.

3) Now examine the regions you have outlined. Look particularly close at the wind barbs for wind direction and also examine the reports of dew point temperature. In question #1, you determined typical wind direction and dew point temperatures associated with a tropical air mass and a polar air mass. Use this additional information to again identify the tropical and the polar air masses in the diagram below. Label the edge of a tropical air mass with a red line and use a blue line to indicate the outer edge of a polar air mass.

4) Are there any differences between your
first analysis and the second analysis?
Explain why they are different (if they indeed are).
Find the Current Air Masses:
5) Using what you learned from this activity, go to the Weather Visualizer
(
CoVis
version |
public
version)
and create a map of the latest surface observations.
From this map, identify
the boundaries of warm and cold air masses (questions #2 and #3)
currently affecting the United States.
You may label your image in one of two ways; 1) by printing out a copy of the image and marking your answers directly onto the printout or 2) by saving the image into your favorite graphics software and modifying the image using that graphics package If the Weather Visualizer is too busy, here are additional web sites for accessing current weather data.
- WXP Purdue
- Ohio State University
- Northern Illinois University
- University Corporation of Atmospheric Research

pressure |
|

precipitation |


