|
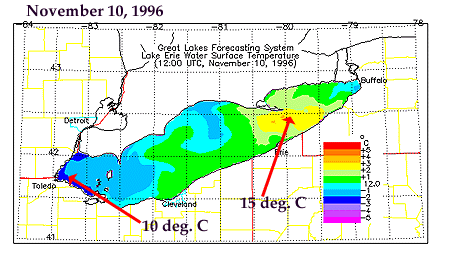
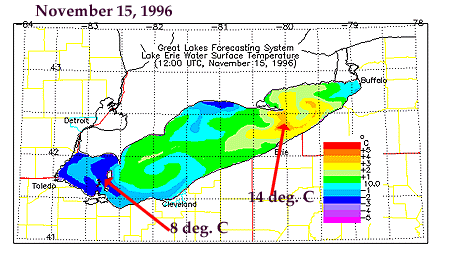
The following images show the Great Lakes Environmental Research Laboratory (GLERL) Lake Erie surface temperature from the beginning and end of the Veteran's Day storm. Temperatures are warmer in the eastern end of the lake, nearing 60F on November 10th. Later in the week, with the long-lived cold air advection temperatures have cooled more than 2 degrees Centigrade which is a strong cooling for a five day period. These early season cold air outbreaks are important drivers for the lake cooldown and subsequent freezing and can lower lake temperatures significantly within a short period of time.

Image by: Great Lakes Environmental Research Laboratory Ann Arbor, MI.
Judging from these analyses, surface temperatures vary greatly in time and space. Computer models that might simulate this and other LES events must account for such variability if the distribution of snowfall is to be portrayed. Often, the lakes are treated with uniform temperature in modeling studies because, until recently, acquiring appropriate "objective" data was difficult.
The warmer temperature in the eastern end of the lake is typical during the fall cooling season. Strong eastward moving wind flow will push warmer surface water to the eastern end of the lake, which is compensated by upwelling of cooler water occurring at right angles of this surface divergence; the cold water upwelling is most noticable in the west end of the lake as can be seen in the analysis.

Image by: Great Lakes Environmental Research Laboratory Ann Arbor, MI.
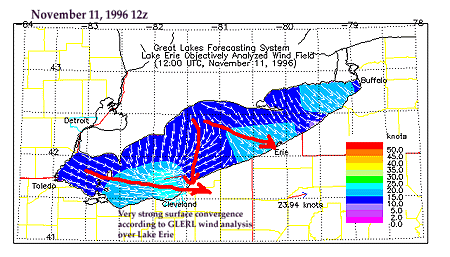
GLERL also runs a realtime analysis program that reproduces wind fields across all of the Great Lakes. The analysis below from the morning of November 11, 1996 is unusual. Fairly strong WNW winds are found in the western basin, as expected in this phase of the storm. However, the overwater air trajectory NE of Cleveland is NE and nearly easterly as it approaches the shoreline. The convergence of air near the shoreline of the NE Ohio snowbelt must be very strong - if the analysis is correct.

Image by: Great Lakes Environmental Research Laboratory Ann Arbor, MI.
Since air is a fluid - the piling up of air at the surface area must be compensated by air moving vertically upward directly above the convergence zone. If the surface convergence is strong the rising motions above this point must also be strong. This is the stage in the storm where some of the heaviest snow was reported, so the divergence/convergence fields are at least consistent with the observed weather.

Surface Analysis |
|

weather statements |


